Made for Iridium in my role as a Power BI Developer. Recreated with dummy metrics.
Developed SQL script and Power BI report to replace 2 twice-weekly manual processes, saving the company 152+ hours annually in addition to providing filtering capabilities to the report.
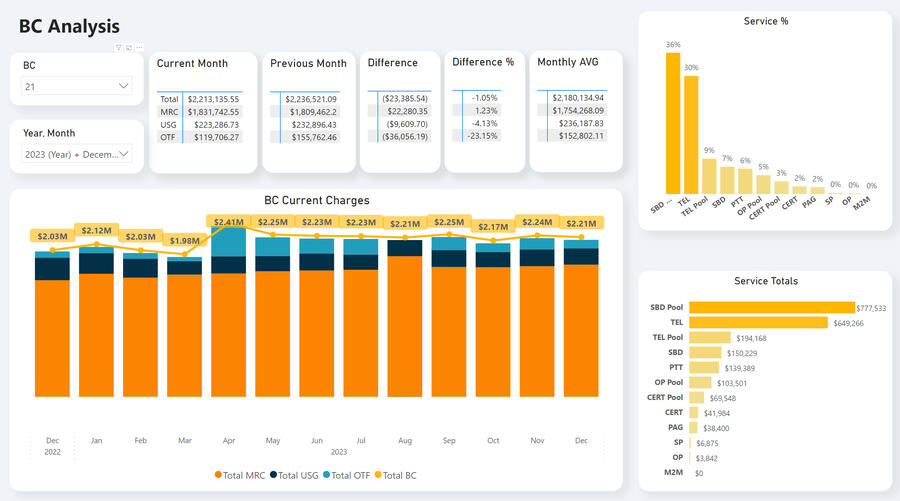
This report answers the following business questions:
1. What are the current month and previous month balances as well as the variance, variance %, and monthly averages?
2. What are the current month and previous month balances as well as the variance, variance %, and monthly averages by customer?
3. What are the current month and previous month balances as well as the variance, variance %, and monthly averages by product?
I took the following steps to complete the dashboard:
1. Exported raw data into Excel and formatted to prepare for Tableau ingestion.
2. Connected Excel file to Tableau report.
3. Created calculated fields to calculate the metrics needed for the report.
4. Created a dashboard with filters to allow users to filter by customer, product, and date.
5. Created a report to show the current month and previous month balances as well as the variance, variance %, and monthly averages.
2. Connected Excel file to Tableau report
Each is modeled in a similar style but tracks metrics specific to that service. All charts included in report below were required by leadership.
>Conclusion:
By automating the process, I saved the company 152+ hours annually in addition to providing filtering capabilities to the report.